Check PDF Tables: Catch Broken Structure Before Screen Readers Guess the Cells
To check PDF tables, confirm the file contains real text, then review whether headers, rows, and columns still make sense when the data is extracted or read without the visual layout.
If headers disappear, columns collapse, or merged cells make the data ambiguous, repair the source and export a cleaner PDF before you share, submit, archive, or publish the file.
That is the short answer. The useful part is learning how to tell the difference between a table that merely looks organized and a table that still behaves like real structured data when a screen reader, keyboard-only workflow, or conversion tool has to interpret it. A fast table check helps you catch accessibility issues, bad exports, and reporting mistakes before the file reaches a client, compliance review, school portal, or public website.
Fastest practical path: make sure the table is real text, inspect the extracted order, verify header logic, then run an accessibility check before you call the PDF done.
In a hurry? Jump to quick start: check PDF tables in about 9 minutes.
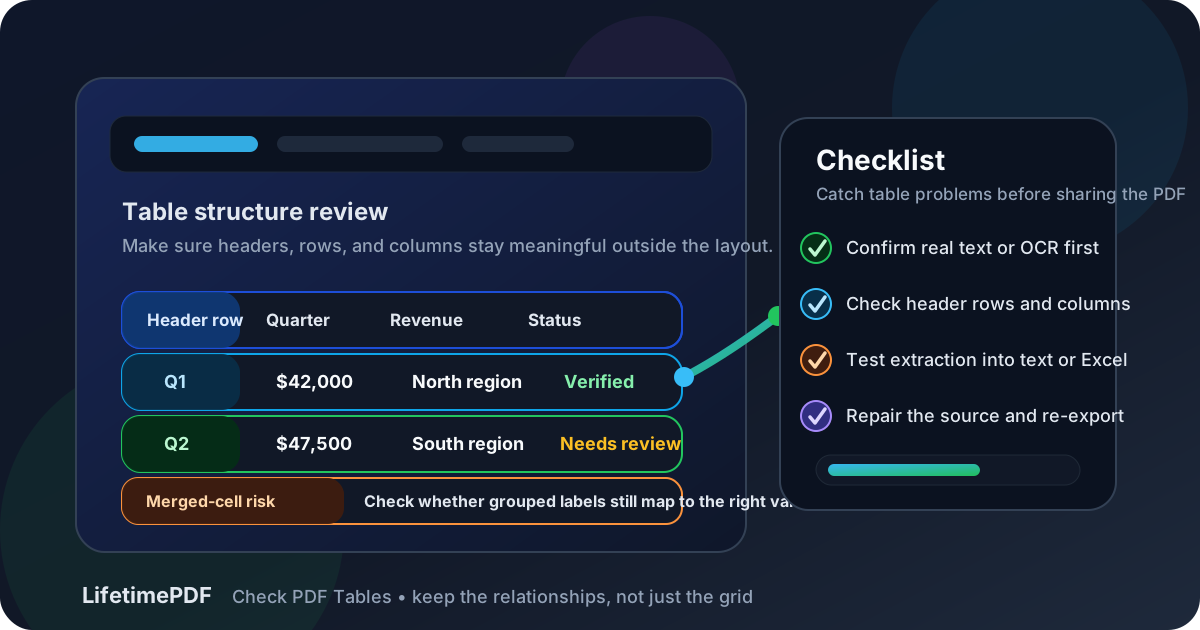
Table of contents
- Quick start: check PDF tables in about 9 minutes
- What good PDF tables actually do
- Step-by-step: practical PDF table review workflow
- Common PDF table failures
- Scans, invoices, statements, and dashboard exports that need extra care
- When to fix the source instead of patching the PDF
- Final checklist before you share or publish the PDF
- Related LifetimePDF tools and guides
- FAQ
Quick start: check PDF tables in about 9 minutes
If your goal is simply tell me whether this table is trustworthy before I send the file out, this quick review catches the problems that matter most:
- Confirm the table is made of real selectable text. If it behaves like an image, run OCR first.
- Look for a clear header row or header column. A reader should be able to tell what each cell belongs to without guessing.
- Run the file through PDF to Text or PDF to Excel and see whether rows and columns stay aligned.
- Check how totals, merged cells, repeated headers, and footnotes behave when the table is extracted or read line by line.
- Use PDF Accessibility Checker and manually spot-check the tables most likely to fail: financial statements, invoices, schedules, comparison charts, and long reports.
What good PDF tables actually do
A good PDF table does more than line up numbers on a page. It preserves relationships: which header belongs to which value, which totals summarize which rows, and how categories, dates, quantities, or statuses connect when the file is read in a different way.
That matters for accessibility, but it also matters for everyday review. Teams export tables to text, Excel, CSV, AI workflows, audit tools, and mobile readers all the time. If the PDF table falls apart outside its original layout, people misread figures, miss headers, or copy bad data into the next step.
| What a healthy table does | What a weak table does instead | Why it matters |
|---|---|---|
| Keeps headers tied to the right cells | Headers disappear or become separated from the values below them | Readers lose context and numbers become guesswork |
| Preserves row and column order | Extraction jumps between columns or reads cells in the wrong sequence | The table stops behaving like usable data |
| Handles merged cells carefully | Category labels float away from the values they describe | Subtotals and grouped rows become confusing fast |
| Stays understandable outside the visual grid | It only makes sense when you stare at the original page design | Screen readers, exports, and quick reviews all suffer |
| Survives conversion and reuse | Numbers, labels, and notes collapse into clutter | Downstream reports, audits, and handoffs become less reliable |
In plain English: the question is not merely can I see the table? The real question is does the table still communicate the same relationships when the layout becomes secondary?
Step-by-step: practical PDF table review workflow
1. Confirm the PDF is not just a picture of a table
If you cannot search, select, or meaningfully copy the text, the table review is premature. Run OCR PDF first so the file has a usable text layer. OCR is not a magic fix, but it turns a picture of data into something you can actually inspect.
2. Check whether headers do real work
Look at the table's top row, first column, and any section labels that divide the data. Can you tell which cells the headers describe? Would a person reading the content line by line still understand what a value refers to? If not, the table may only be visually organized.
3. Test extraction instead of trusting the design
Use PDF to Text to see how the table reads when layout polish disappears. Then use PDF to Excel if you want a quick reality check on whether columns, totals, and row groupings stay intact. If the extracted output becomes scrambled, the PDF table likely has structural weaknesses worth fixing.
4. Watch for merged cells, subtotals, and repeated headers
These are the places where many PDF tables start lying to people. A merged heading may visually cover six columns while extraction treats it like one lonely label. Repeated header rows on later pages may vanish or duplicate badly. Subtotals can drift away from the rows they summarize. If any of those elements become ambiguous, the table is not safe just because it looks tidy on screen.
5. Run an accessibility review as a triage layer
PDF Accessibility Checker helps surface broader structure problems quickly. Use it as a triage step, then make a human judgment about the tables that matter most. A compliance report, rate card, product matrix, school schedule, or invoice archive deserves more than a casual glance.
6. Repair the source and export again if the table logic is weak
If the PDF came from Excel, Google Sheets, Word, a report builder, or semantic HTML, the cleanest fix is usually upstream. Repair the table in the editable source, simplify confusing merges, clarify headers, and export again. That is almost always cleaner than trying to rescue a structurally weak final PDF one symptom at a time.
Reliable sequence: OCR if needed, test extraction, confirm headers and order, run an accessibility check, then repair the source before the final export.
Common PDF table failures
Table problems tend to repeat themselves. Once you know the usual failure patterns, you can spot them much faster.
| Failure pattern | What goes wrong | Better approach |
|---|---|---|
| Visual-only headers | A bold top row looks important, but extraction does not preserve the relationships properly. | Use a cleaner source structure with explicit header logic. |
| Columns read in the wrong order | Text jumps across the page or combines unrelated values. | Review reading order and rebuild the source if the export path is weak. |
| Merged-cell confusion | Category labels float away from the rows or columns they describe. | Reduce decorative merges and make grouping clearer upstream. |
| Totals disconnected from details | Subtotals and grand totals lose context when the grid collapses. | Place totals clearly and test extraction before publishing. |
| Scan cleanup mistaken for structure repair | OCR restores text, but the table still behaves like a fragile image-derived layout. | Use OCR as recovery, then assess whether the table still needs source repair. |
One simple smell test: if you had to explain the table aloud without showing the page, would the relationships still be obvious? If not, the structure is probably too dependent on visual placement.
Scans, invoices, statements, and dashboard exports that need extra care
Some tables deserve more suspicion than others. These file types break often enough that they are worth deliberate spot-checking.
Scanned tables
Copier scans, photographed pages, and camera-based workflows often turn columns into guesswork until OCR restores a text layer. Even after OCR, messy scans may still split numbers, merge adjacent columns, or treat ruling lines as part of the content.
Invoices, bank statements, and billing summaries
These files look deceptively simple. But dates, line items, tax columns, balance rows, and footnotes can become ambiguous very quickly when the reading order is weak. If money is involved, do not settle for “it seems readable enough.”
Dashboard exports and BI reports
Auto-generated PDFs from analytics tools often prioritize visual polish over structural clarity. Multi-level headers, stacked metrics, repeated section labels, and page-break behavior can all make the extracted output worse than the on-screen design suggests.
Large compliance and operations reports
These documents commonly combine tables, notes, footers, section dividers, and repeated headings across many pages. A table that looks fine on page 2 may become chaotic by page 27 if the export path is inconsistent.
Where people get fooled
The grid lines are straight, the columns look aligned, and the totals seem easy to see. That visual neatness creates false confidence. A real table review asks whether the relationships survive extraction, accessibility review, and downstream reuse—not just whether the page design looks professional.
When to fix the source instead of patching the PDF
Source-first repair usually wins when the table problem is broad rather than local. If headers are inconsistent, merges are doing too much work, or several pages break during extraction, editing the final PDF is rarely the best long-term move.
Repair the source when:
- multiple tables in the same file behave differently,
- merged cells are carrying too much meaning,
- the PDF came from Excel, Sheets, Word, HTML, or a reporting template you still control,
- table problems appear alongside reading-order, heading, or tagging issues,
- the document will be revised or reused again later.
If the file is part of a broader accessibility review, pair this table check with accessibility, reading order, headings, and alt text. Tables do not live in isolation. Weak structure in one area often travels with weak structure elsewhere.
Final checklist before you share or publish the PDF
- The PDF has real searchable text, or OCR was completed first.
- Each table has clear headers that still make sense when the layout is reduced or extracted.
- Rows and columns stay aligned in text or Excel output instead of collapsing into clutter.
- Merged cells, repeated headers, subtotals, and footnotes were spot-checked deliberately.
- Scans, financial tables, and dashboard exports received extra scrutiny.
- Broad table issues were repaired in the source file when possible.
- The final exported PDF was tested again instead of being assumed correct.
Related LifetimePDF tools and guides
Useful tools
Need a cleaner review workflow for tables, text extraction, and accessibility checks? LifetimePDF combines OCR, extraction, structure checks, and export tools in one pay-once toolkit.
FAQ
How do I check PDF tables quickly?
Confirm the file has real text, inspect whether headers and cells stay in a sensible order, and test extraction so the rows and columns do not collapse when the layout disappears.
Can a PDF table look organized and still have bad structure?
Yes. Many PDF tables look polished on screen while still having weak headers, broken column order, or ambiguous merged cells underneath.
Is PDF to Excel useful for checking table quality?
Usually yes. It is a fast way to see whether the table behaves like structured data or collapses into messy values during extraction.
Should I OCR a scanned PDF before checking tables?
Usually yes. OCR restores a text layer so you can evaluate whether the table behaves like real content instead of a picture of a table.
Should I fix PDF tables in the final PDF or in the source file?
If you still control the source, fix it there first. A cleaned-up spreadsheet, report template, Word document, or HTML table usually exports a better PDF than after-the-fact patching.
Published by LifetimePDF — Pay once. Use forever.